
Webinar description
A small mean shift can slip past standard control chart rules. In this webinar’s live demo, a shift of roughly 0.75 sigma never triggered the nine-in-a-row rule, and the t test stayed under its threshold. The shift showed up only because the exponentially weighted moving average (EWMA) spent 85% of its time on one side of the centerline.
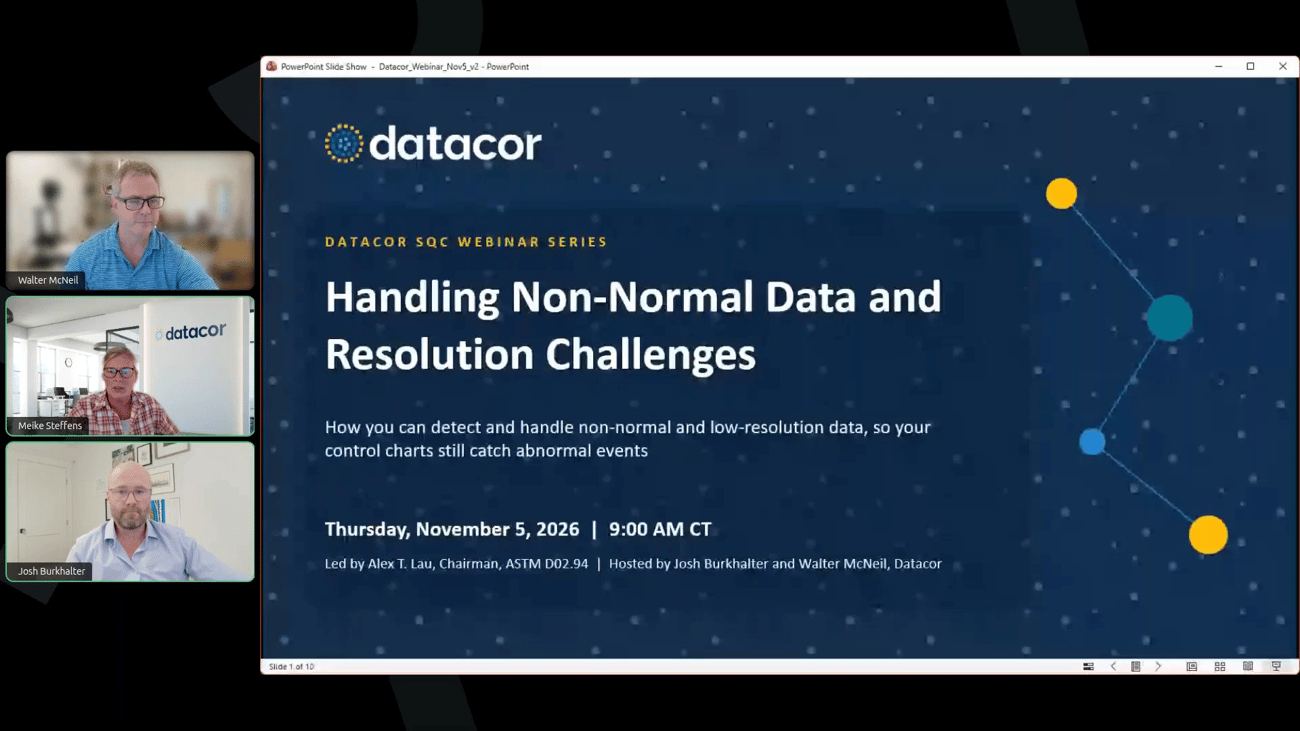
In this second session of the series, ASTM D6299 authority Alex Lau covers how to spot a mean shift during Stage 2 control chart operation, respond to an out-of-control signal, and keep chart coverage after a QC material change or recalibration. The session closes with a demo in BLISS SQC+ that runs a periodic chart update, catches a mean shift, and switches to Procedure 2B for a new QC batch.
What you’ll learn
- How I and EWMA charts (Strategy 2) detect a mean shift, and how to confirm an out-of-control signal before acting on it
- Which checks must pass before you update a control chart centerline, and how they guard against adjusting away a slow drift
- How Procedure 2B keeps your charts in service after a QC material change or recalibration while a new centerline is established
Speaker information
Alex Lau has more than 45 years of industry experience, including 31 years with ExxonMobil and Imperial Oil in refining, where he served as Exxon’s corporate specialist in fuels blending optimization, inline blending, process analyzers, test method quality assurance, and statistical assurance. He chairs ASTM Subcommittee D02.94 on Quality Assurance and Statistics, serves as vice chair of D02.25 on Validation of Process Analyzers, and convenes ISO TC 28 Working Group 2 on statistical methods.
BLISS SQC+ control charting
BLISS SQC+ follows ASTM D6299 and D7372 and flags when a chart needs attention, including signals, pending results, and charts due for a periodic update. During an update, it runs the F test and t test, checks both centerline backstops, and grays out actions the data doesn’t permit. It also sets up Procedure 2B charts after a QC batch change, captures results from LIMS and instrument interfaces, imports proficiency testing reports, and records every decision in an audit trail for compliance reporting.
See it on your own control charts
Talk with a Datacor expert about how BLISS SQC+ applies ASTM D6299 checks and Procedure 2B to your lab’s charts.
Frequently asked questions
What is Procedure 2B?
Procedure 2B is the dynamically updated I and EWMA chart in ASTM D6299, formerly called Q chart option 1. It’s technically equivalent to I and EWMA charts but needs no predetermined centerline. Control limits are recalculated with each new result and applied back to every result from the new batch, and the chart is operational from the second result once the first result is independently validated.
When should a lab switch to Procedure 2B?
The two most common cases are a QC batch change, after a batch runs out or degrades, and a recalibration or major maintenance event. A recalibration changes the system’s state, so the expected value needs to be reestablished even with the same QC material. Procedure 2B requires a reliable sigma estimate, which can come from the previous chart if the new material is similar, and a first result validated with a check standard.
When can a control chart centerline be updated?
After a t test shows no significant difference, two backstops still apply: the t statistic can’t exceed 1.7, and the EWMA from the new data must spend less than 75% of its time on one side of the centerline. Four centerline adjustments in a row in the same direction trigger a mandatory check standard validation.
Why do earlier points fall outside the limits on a Procedure 2B chart?
Procedure 2B looks backward. Each new result produces updated limits that are projected back over all results from the batch, much like checking a boat’s wake to confirm it’s traveling in a straight line. If earlier points fall outside the new limits, the system is out of control now, at the latest result. It doesn’t mean the system was out of control when those earlier results were recorded.
Can Procedure 2B be used with custom action limits?
No. Custom action limits are used when a method lacks the resolution for I and EWMA charts, and Procedure 2B is equivalent to those charts. In this case, use Procedure 1 concurrent testing and start the new QC batch while about 20 aliquots of the current batch remain.