Webinar Overview
Control charts only work when your QC data meets the assumptions behind them. In this session, Alex Lau, chair of ASTM D02 Subcommittee 94, shows how to spot non-normal and low-resolution data using Q-Q plots and Anderson-Darling statistics under ASTM D6299. He also explains when to switch to a run chart with user-defined action limits so you can still catch abnormal events. The BLISS SQC+ team then shows how the software flags these problems and builds the right chart in a few clicks.
About the Presenter
Alex T. Lau brings over 40 years of experience in the petroleum refining industry and deep expertise in quality assurance and statistical methods. He is a leading authority on D6299 and serves as Chairman of the ASTM D02.94 Subcommittee on Quality Assurance and Statistics, and Vice Chair of ASTM subcommittees focused on precision and analyzer validation standards. He previously worked with Imperial Oil (an ExxonMobil affiliate) before retiring and forming his own consulting practice, TCL-Consulting. His background includes extensive work with process analyzer applications, statistical quality control, and standard implementation. Alex holds a Bachelor’s degree in Applied Science and Engineering Physics, is a registered Professional Engineer, and is certified as a Quality Engineer.
What You’ll Learn
- Verify your data first: check QC data for outliers, normal fit, variation and stability before building a control chart.
- Read the statistics: use Q-Q plots alongside AD-RMS and AD-MR to judge whether the normal model fits your data.
- Find resolution problems: recognize the staircase pattern that means your data has fewer than six unique values.
- Fix rounding at the source: see why keeping an extra decimal for internal charting doesn’t violate test method reporting rules.
- Set action limits: build a run chart with user-defined action limits using percentiles, repeatability or resolution-based limits.
- Find root causes: trace non-normal behavior to sample, calibration, operator or instrument issues.
- Detect trends and cycles: compare AD-RMS and AD-MR to spot autocorrelated data.
- See it in BLISS SQC+: watch the software flag these problems and build the right chart in a few clicks.
How BLISS SQC+ Helps
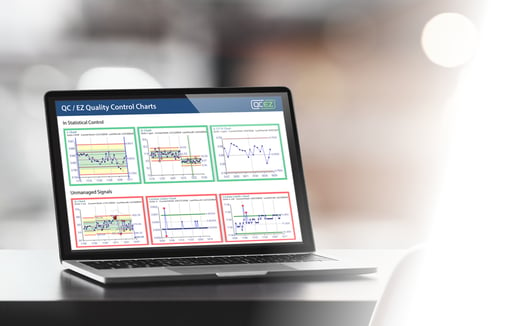
In the demo, BLISS SQC+ showed the Q-Q plot, both Anderson-Darling statistics and the count of unique values on one screen, with failing results flagged in red. For a manual cloud point dataset with four unique values, the team built a run chart with user-defined action limits using SAS-method percentiles and rational rounding. The moving range chart and run rules were turned off, since the result is a go/no-go tolerance chart rather than a control chart.
BLISS SQC+ can be integrated into BLISS LIMS or with any third-party LIMS.
Keep Learning
This session is part of Datacor’s free webinar series on ASTM D6299, SQC and EPA Part 1090 compliance. Upcoming topics include the Q-procedure. See the schedule at datacor.com/events. To go deeper, ask about Datacor’s D6299 training courses and the QC mentorship program.
See how Datacor's BLISS SQC+ is able to connect with your existing LIMS or scale to multiple laboratories.